Decision Making - Venn Diagram Practice
10 questions - all Venn diagram types - full working and explanations
Venn Diagram Strategy Guide
- Work from the centre outward. Fix the all-three value first.
- For exactly two, add only the pairwise-only regions. Do not include the all-three region.
- For at least one, use total minus neither.
- Always check whether the total adds up correctly.
Question 1
Read the diagramThe diagram gives information about the number of members at a sports club who participate in different activities.
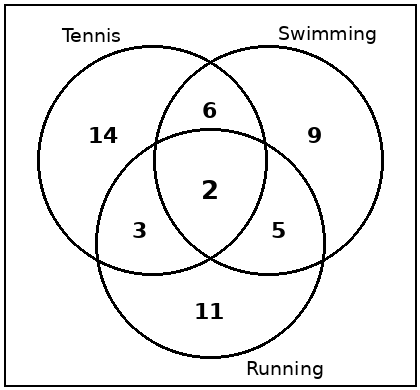
Which one of the following statements is true?
Show answer and explanation
Exactly two activities = 6 + 3 + 5 = 14.
Question 2
Read the diagramThe Venn diagram shows information about 49 students and the subjects they study.
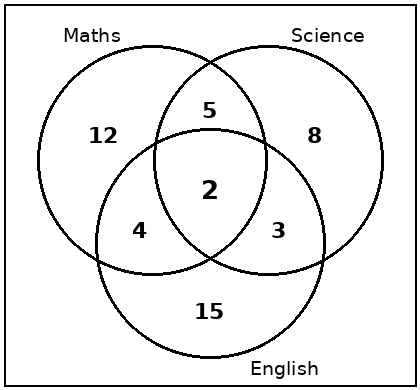
Which one of the following statements is true?
Show answer and explanation
Exactly one subject = 12 + 8 + 15 = 35.
Question 3
Read the diagramThe diagram shows information about 80 teenagers and which social media platforms they use. 11 teenagers do not use either platform.
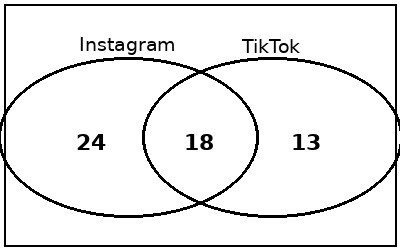
Which one of the following statements is true?
Show answer and explanation
The shared region in the diagram is 18, so 18 teenagers use both platforms.
Question 4
Choose the best diagram60 households were surveyed about whether they own dogs, cats or fish.
- 35 own dogs.
- 28 own cats.
- 15 own fish.
- 12 own dogs and cats.
- 5 own dogs and fish.
- 4 own cats and fish.
- 2 own all three.
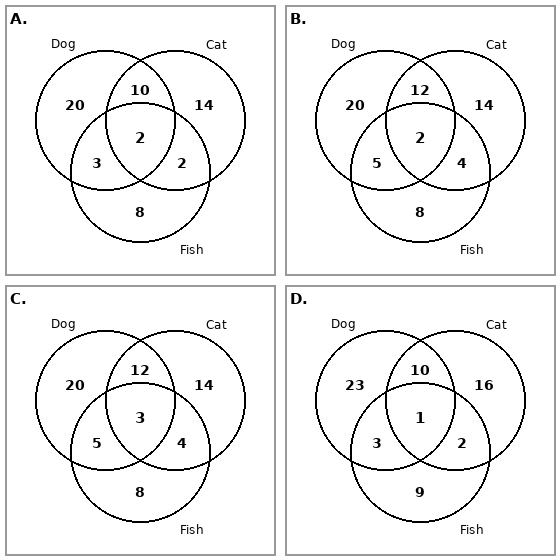
Which of the following diagrams best represents the data above?
Show answer and explanation
When the diagram uses total pairwise overlaps including the all-three region, option B matches the given data.
Question 5
Read the diagramThe diagram gives information about the number of people in a travel club who have visited certain countries.
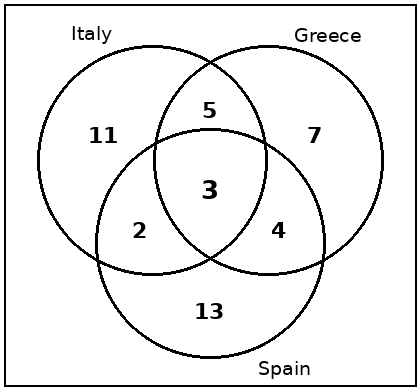
How many people in the travel club have visited at least two of the three countries?
Show answer and explanation
At least two countries = exactly two + all three = (5 + 2 + 4) + 3 = 14.
Question 6
Choose the best diagram80 students were surveyed about the languages they speak.
- 50 speak English.
- 30 speak French.
- 25 speak Spanish.
- 15 speak English and French.
- 10 speak English and Spanish.
- 8 speak French and Spanish.
- 5 speak all three languages.
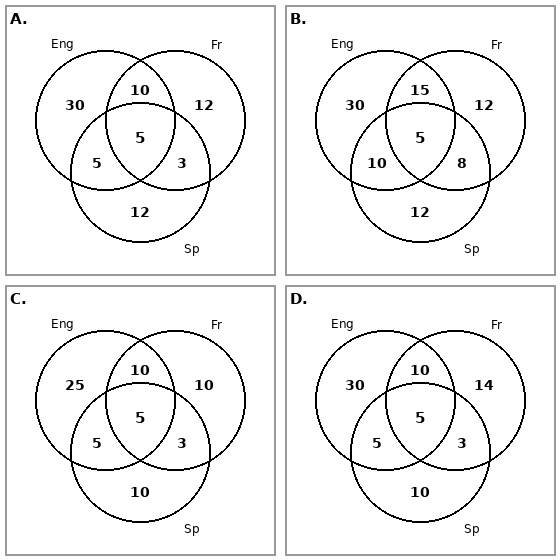
Which of the following diagrams best represents the data above?
Show answer and explanation
The only-region values work out to 30, 12, 12, 10, 5, 3, and 5, so option A is correct.
Question 7
Read the diagramThe Venn diagram shows information about 55 members at a gym and the classes they attend.
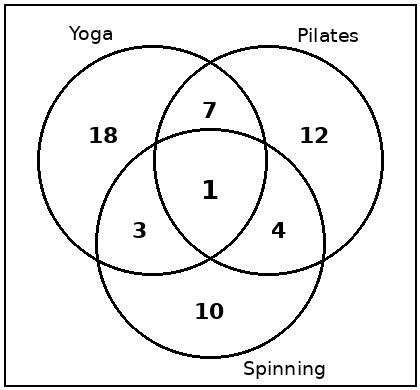
How many more members attend only Yoga than attend all three classes?
Show answer and explanation
Yoga only = 18 and all three = 1, so the difference is 17.
Question 8
Choose the best diagram100 students were asked which university clubs they belong to.
- 40 belong to Drama.
- 35 belong to Music.
- 30 belong to Art.
- 12 belong to Drama and Music.
- 8 belong to Drama and Art.
- 10 belong to Music and Art.
- 4 belong to all three clubs.
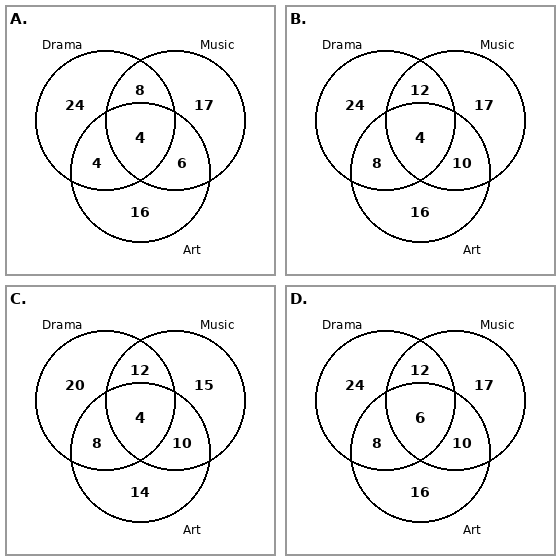
Which of the following diagrams best represents the data above?
Show answer and explanation
The totals align with option B when the pairwise overlaps shown in the diagram include the all-three region.
Question 9
Read the diagramThe Venn diagram shows information about 96 patients at a clinic and their blood types.
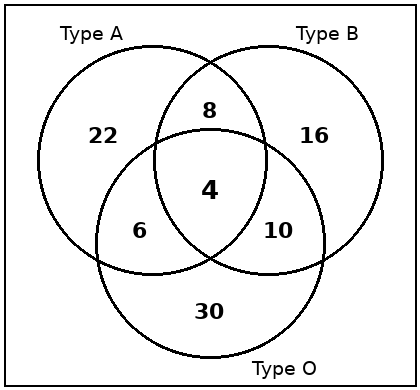
Which one of the following statements is true?
Show answer and explanation
Type A total = 22 + 8 + 6 + 4 = 40. Type B total = 16 + 8 + 10 + 4 = 38, so Type A is greater.
Question 10
Read the diagramThe diagram gives information about 80 commuters and whether they use a car or train to travel to work. 12 commuters do not use either a car or a train.
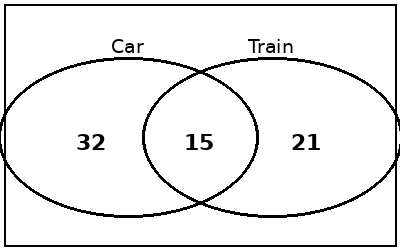
How many more commuters use only a car than use only a train?
Show answer and explanation
Car only = 32 and train only = 21, so the difference is 11.
Answer Key
Q1 - B | Q2 - C | Q3 - C | Q4 - B | Q5 - B
Q6 - A | Q7 - C | Q8 - B | Q9 - C | Q10 - B
Adapted from the uploaded file: UCAT ANZ Mastery - Decision Making: Venn Diagram Practice.